PostHog and A/B testing reveal when an expert’s assumption is wrong

What will you learn from this blog post?
The expert bubble can be misleading: From our own perspective, a “better” version does not always lead to a better outcome, as our assumptions often differ from customers’ real behaviour.
Case Vianor and the surprising outcome: We trialled a new tool on Vianor’s website with an A/B test, which disproved our original hypothesis.
Data helps avoid costly mistakes: Changes pushed blindly to production can cause losses that A/B testing could have fully prevented.
PostHog can do it all: This modern analytics tool enables A/B testing both as a light no-code experiment and as a broader code-based implementation.
Why should assumptions be questioned?
Have you ever noticed how website redesigns are justified with claims such as “the new layout is clearer for the user” or “the new version is more logical”? I don't find this surprising at all, because we often rely heavily on our own intuition and visual judgement. Furthermore, the whole team behind the redesign may well agree with these claims. Yet this team is often very much stuck in its own bubble, which means interface clarity and the logic of the user journey are seen only through their own expert lenses.
A/B testing takes those glasses off and brings data into the redesign process. During the test, we show two versions of the site at the same time and measure how end-user behaviour actually differs between the new and the old version. The figures then tell us concretely which version drives traffic more effectively towards the goal, in other words, which converts better. With a single test, we can see the difference in user experience and its impact on sales. These are the cornerstones of A/B testing, which you can read more about in our previous blog post: A/B testing keeps the user at the centre of design.
Why A/B test with PostHog?
In short: we chose PostHog because we found it agile, scalable and comprehensive in terms of features.
PostHog and other modern A/B testing tools explain transparently how they calculate performance and justify one version being better than another. At its core, the calculation is based on statistics, but you don't need a degree in statistics to interpret the numbers (though that wouldn't hurt either). PostHog provides session recordings, versatile visualisations and AI-generated summaries to support A/B testing, making reporting and analysis of results easier.
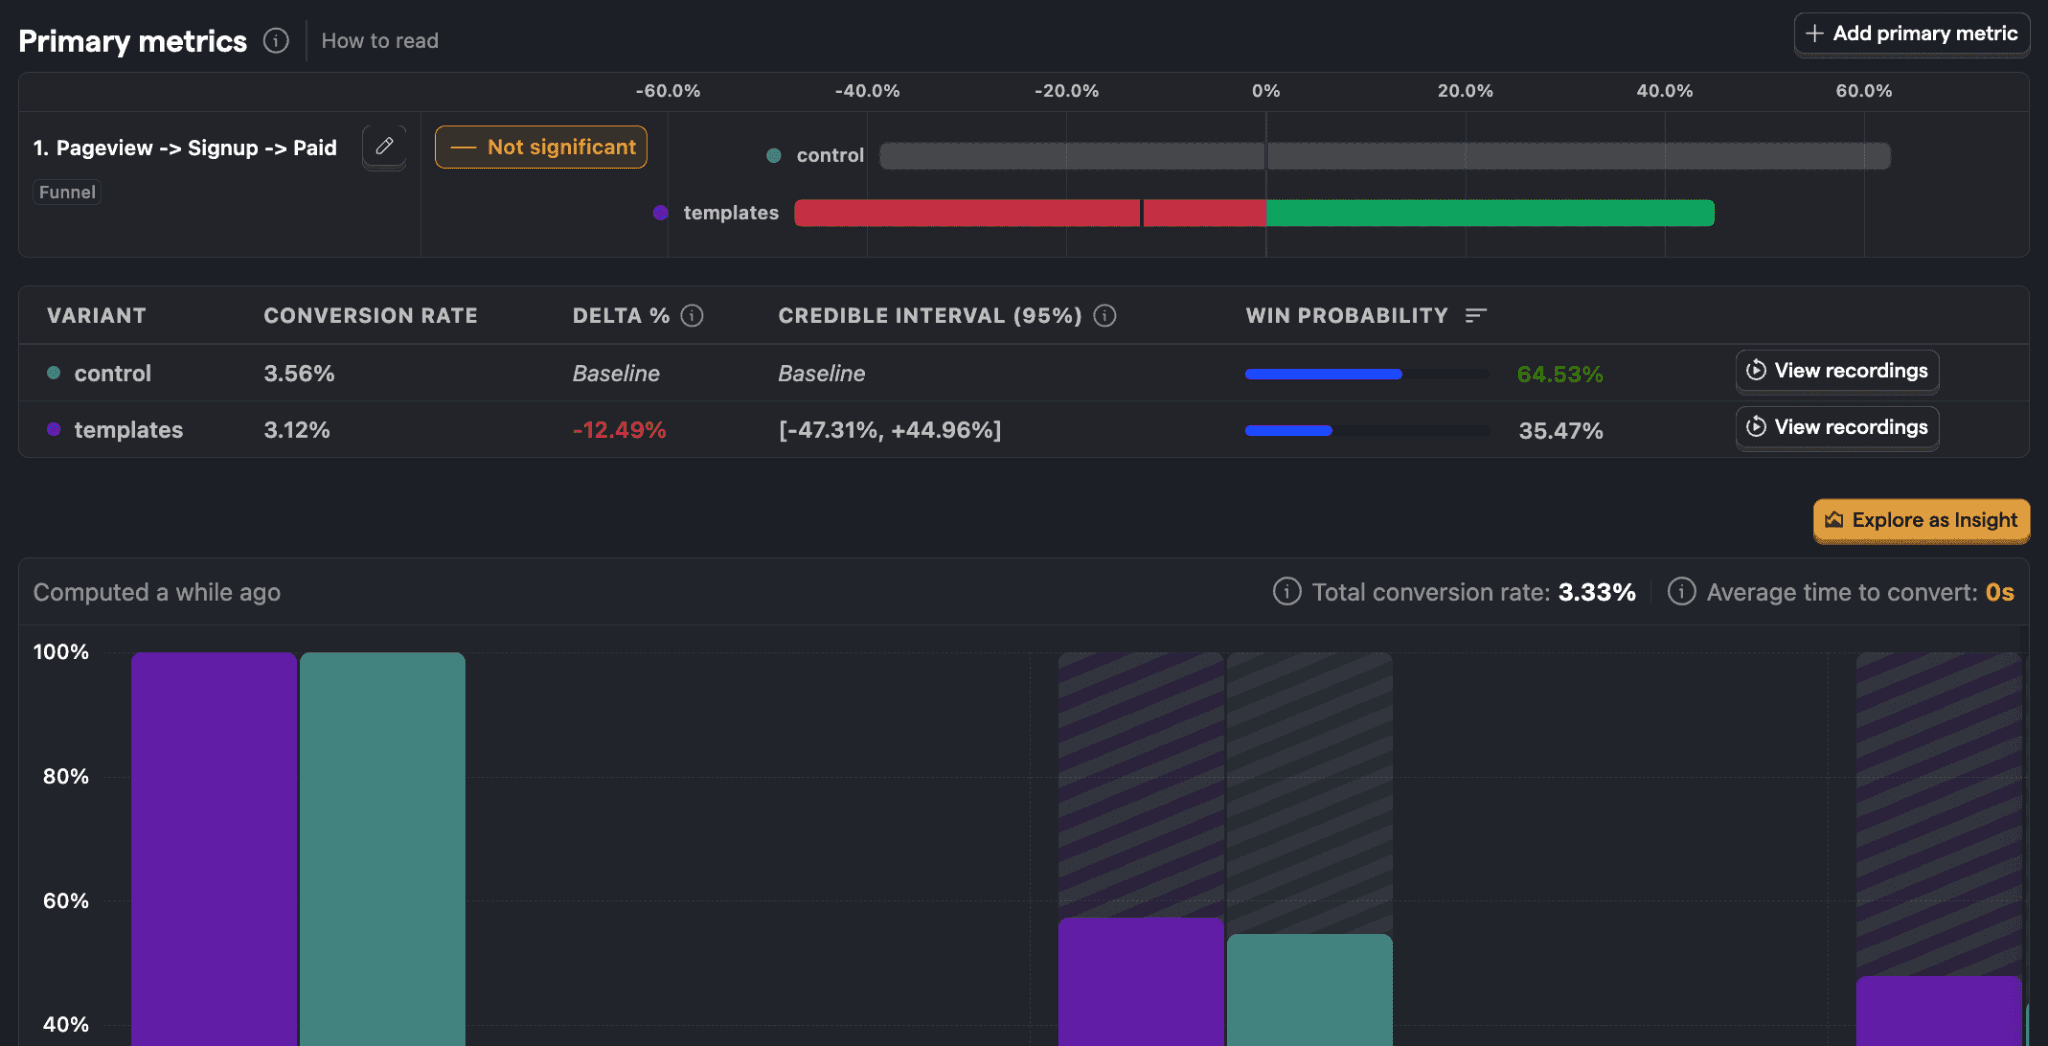
Example of a PostHog A/B test report. Note the difference in conversion rate between the variants (in the example, control and templates) and its significant effect on win probability. (Image source: PostHog)
With PostHog, you can run lightweight visual A/B tests entirely without code by using its no-code editor. For more demanding tests, however, versions are created directly in code, and “Feature Flags” are added to them. These are like switches that allow PostHog to split the test audience and show different versions. We used this code-based approach with our client when our goal was to optimise the mobile version of the website homepage.
Case Vianor: The old, busier version beat the new, clearer one
When Vianor recently adopted PostHog, we immediately decided to verify the tool’s capabilities in practice. We ran an A/B test on Vianor’s website to find out whether mobile user conversion could be increased by making the homepage layout clearer. We assessed clarity specifically from the expert bubble I mentioned above, which often differs from the end customer’s view and experience.
Based on this assessment, we created a new test version (shown on the right). In it, the busy background image has been replaced with a darker tyre pattern, and the two-line heading has been condensed into a single line.
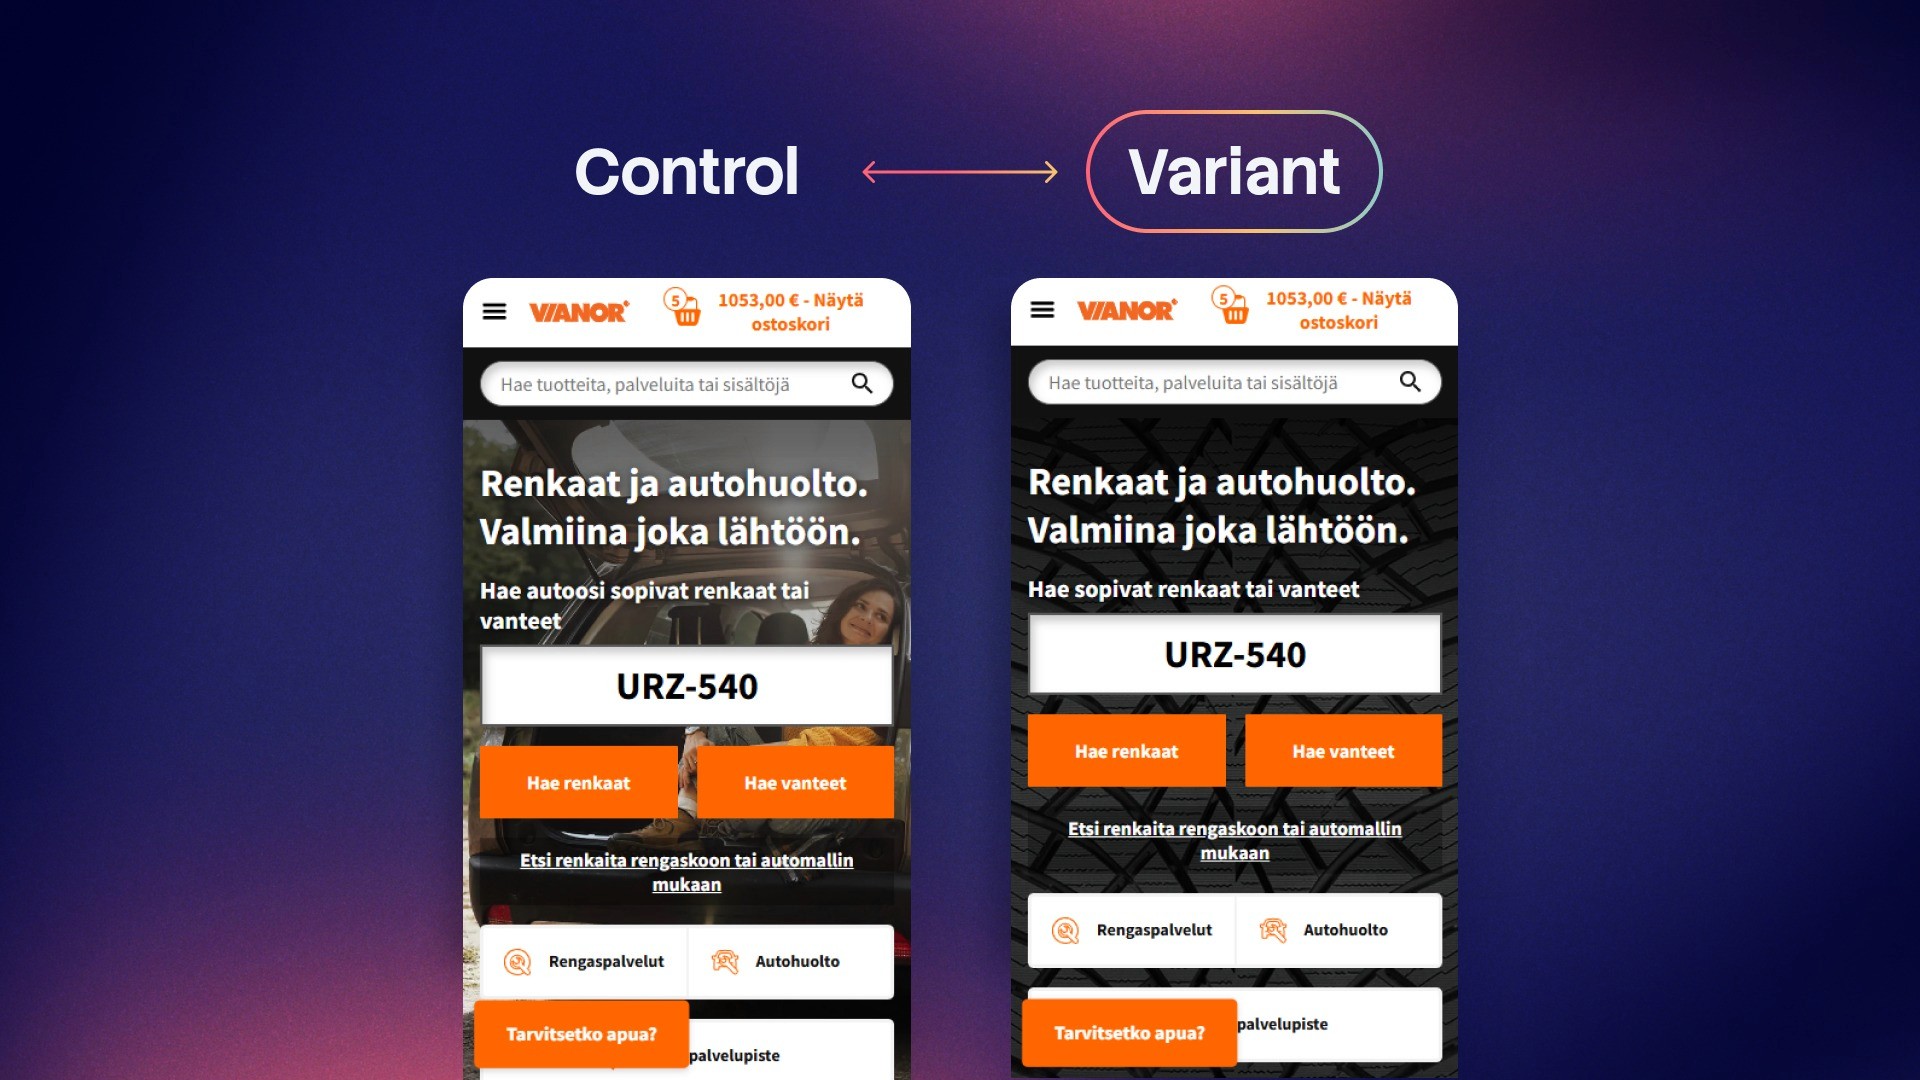
Original version (control) and new version (variant) of the A/B test. Which would you choose?
Our hypothesis was that the new version would increase the use of tyre and wheel rim search, i.e. clicks on the homepage’s most important buttons, and thus lead to higher-quality visits. In the test, we also used secondary metrics, meaning we also tracked the use of buttons leading to service pages in PostHog so that we could see the overall effects of the redesign. The table below shows how the new version performed alongside the original.
Version | Original (control) | New (variant) |
Users | 14,400 | 14,400 |
Use of tyre and wheel rim search (primary metric) | 37.63% (5,410 users) | 37.03% (5,320 users) |
“Find tyres…” button (secondary metric 1) | 6.15% (883 users) | 6.16% (884 users) |
Buttons leading to services (secondary metric 2) | 18.13% (2,610 users) | 18.44% (2,650 users) |
Winning probability calculated by PostHog | 85.5% | 14.5% |
Based on the data, we can conclude that the new version did not lead to the higher-quality visits we expected. Quite the opposite! The clearer, single-line test version lost to the original, slightly busier layout. A difference of less than one percentage point (37.63% vs 37.03%) in the use of tyre and wheel rim search may sound negligible, but on a large online service it can mean tens or even hundreds of thousands of euros in lost sales over a year.
It is also very important to note that when testing, increasing sales is not the only win, and poor performance of a test version does not mean the test has failed. Without PostHog’s data, we would probably have launched the new “clearer” version and lost money.
Five tips for effective A/B testing
Best practices and UX rules are only hypotheses until they are proven right with data. With these tips, you can make tests reliable and decision-making data-driven:
Use a cross-functional team: A/B testing benefits from data and analytics expertise, UX and coding skills, and business understanding.
Choose the tools and implementation approach according to the need: Simple text changes call for a lighter tool, but broader and structural changes should be taken to code level to ensure quality and reliability.
Always define a secondary metric: Looking at one metric or button doesn't tell the whole story, because even simple changes often have multi-layered effects.
Give the test time: Enough data must accumulate so that weekday variation and more hesitant shoppers are included in the results.
A “lost” test is a successful risk reduction: When a hypothesis is proven wrong, you avoid publishing a poor redesign.
If you feel your website is in need of change, but all you have to support you are guesses, get in touch! We at Crasman can help you get started quickly. A/B testing doesn't need to be a huge project when we choose the right tools together for the right purpose.

Aleksi Haimakainen
Web Analyst